
In the realm of server management and website monitoring, staying informed about the status and health of your servers and services is paramount. Enter Uptime Kuma, an emerging star in the world of open-source monitoring tools.
This blog post will explore what Uptime Kuma is, its key features, and why it’s becoming a go-to choice for IT professionals and web administrators.
Introduction to Uptime Kuma
Uptime Kuma is an open-source, self-hosted monitoring tool that comprehensively views the uptime, downtime, and response times of various internet services and servers.
It’s a powerful alternative to paid services like Uptime Robot, offering extensive customization, control, and privacy due to its self-hosted nature.
Key Features of Uptime Kuma
- Multi-Service Monitoring: Supports monitoring HTTP/S, TCP, HTTP(s) Keyword, Ping, DNS Record, Push, Steam Game Server, and more.
- Real-Time Updates: Provides real-time status updates for all monitored services.
- Alerts and Notifications: Integrates with popular notification services like Telegram, Discord, Gotify, Slack, Pushover, and email.
- Customizable Dashboard: Offers a user-friendly and customizable dashboard to view and manage the status of all services.
- Multi-Language Support: Available in multiple languages, making it accessible to a global user base.
What does it look like?
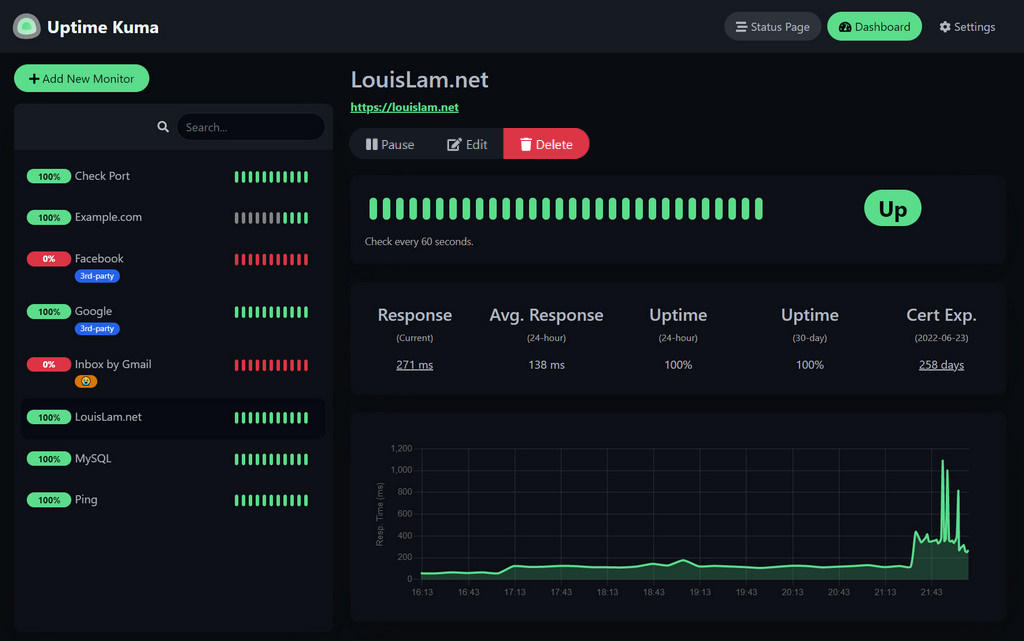
The screenshot shows Uptime Kuma’s dashboard on the author’s GitHub page.
Setting Up Uptime Kuma
Uptime Kuma’s setup process is straightforward:
- Installation: It can be installed on various platforms, including Docker, a popular choice for its ease of use and portability.
- Configuration: After installation, services and servers to be monitored are added to the dashboard. Each service can be configured with specific monitoring parameters.
- Notifications Setup: Configure notification channels to receive alerts about any status changes.
Benefits of Uptime Kuma
- Cost-Effective: Being open-source, it is free, offering a cost-effective solution for startups and businesses.
- Privacy and Security: Self-hosting means data stays within your control, enhancing privacy and security.
- Flexibility and Customization: Offers great flexibility and customization options to cater to specific monitoring needs.
- Active Community Support: Benefits from robust community support and regular updates.
Use Cases for Uptime Kuma
- Website Monitoring: Ideal for webmasters and bloggers to keep track of their website’s uptime.
- Server Health Monitoring: IT professionals use it to monitor server health and network status.
- Business Operations: Businesses employ it to ensure critical services are always running for their customers.
Summary
Uptime Kuma is a shining example of the capabilities of open-source software in professional-grade server and service monitoring. It strikes an excellent balance between functionality, ease of use, and cost-effectiveness.
Whether you’re managing a single website or an array of servers, Uptime Kuma is a tool that can adapt to your needs, ensuring you’re always in the know about the status of your digital infrastructure.
Installing Uptime Kuma on Kubernetes
Installing Uptime Kuma on Kubernetes involves several steps, including setting up a deployment and service configuration. Here’s a general outline of the process:
Prerequisites
- Kubernetes Cluster: Ensure you have a working Kubernetes cluster.
- kubectl: Have kubectl installed and configured to communicate with your cluster.
- Persistent Storage: Optionally, set up persistent storage if you want to retain data across pod restarts.
Steps to Install Uptime Kuma on Kubernetes
1. Create a Deployment Configuration
- You need to create a Kubernetes deployment configuration for Uptime Kuma. This can be done by creating a YAML file. I created a file called ‘
uptime-kuma-deployment.yaml'. - I defined the Uptime Kuma Docker image, ports, and other configurations in this file.
Here is an example of what the deployment file looks like:
apiVersion: apps/v1
kind: Deployment
metadata:
  name: uptime-kuma
spec:
  replicas: 1
  selector:
    matchLabels:
      app: uptime-kuma
  template:
    metadata:
      labels:
       app: uptime-kuma
    spec:
      containers:
        - env:
            - name: UPTIME_KUMA_PORT
              value: "3001"
            - name: PORT
              value: "3001"
          image: louislam/uptime-kuma:1.23.3
          imagePullPolicy: Always
          name: uptime-kuma
          ports:
            - name: uptime-kuma
              containerPort: 3001
              protocol: TCP
          volumeMounts:
            - mountPath: /app/data
              name: vol-uptime-kuma
      volumes:
        - name: vol-uptime-kuma
          persistentVolumeClaim:
            claimName: pvc-uptime-kuma
---
apiVersion: v1
kind: PersistentVolumeClaim
metadata:
  name: pvc-uptime-kuma
spec:
  accessModes:
    - ReadWriteOnce
  storageClassName: longhorn
  resources:
    requests:
      storage: 1Gi
Note that this yaml includes setting up a persistent volume claim on Longhorn to store the configuration data and this is mounted to the /app/data folder within the container.
2. Deploy to Kubernetes
I deployed the yaml file to Kubernetes with the following command: –
kubectl create -f uptime-kuma-deployment.yaml3. Create a Service
- To access Uptime Kuma externally, you must create a Kubernetes service.
- I created another YAML file called ‘
uptime-kuma-service.yaml', to define the service.
The contents of the file are: –
apiVersion: v1
kind: Service
metadata:
  name: uptime-kuma-service
spec:
  selector:
    app: uptime-kuma
  ports:
  - name: uptime-kuma
    port: 3001
I applied this to Kubernetes with the following command: –
kubectl create -f uptime-kuma-service.yaml4. Access Uptime Kuma
In other posts, I write about using Traefik as the ingress into my services. This is also the case with Uptime Kuma. I created a file called ‘ingressroute.yaml’ to contain this: –
apiVersion: traefik.containo.us/v1alpha1
kind: IngressRoute
metadata:
  name: uptime-kuma
spec:
  entryPoints:
    - websecure
  routes:
    - match: Host(`uptime.intrasoftware.uk`)
      kind: Rule
      services:
        - name: uptime-kuma-service
          port: 3001
Again, I deployed this to Kubernetes using the following command: –
kubectl create -f ingressroute.yamlFinal Notes
- Version: Make sure to specify the correct version/tag of the Uptime Kuma Docker image.
- Configuration: Adjust the configuration (like resource limits, number of replicas) according to your needs.
- Security: Consider security aspects such as network policies, especially if deploying in a production environment.
This guide provides a general approach to deploying Uptime Kuma on Kubernetes. Depending on your specific Kubernetes setup and requirements, additional steps or modifications might be necessary.


