
What is one?
An SQL Server execution plan helps investigate performance issues with queries. As Database professionals, we receive user complaints that systems run slowly. Query results that used to take two or three seconds suddenly require 2 or 3 minutes.
Troubleshooting may require investigating server resources (CPU, memory), statistics, disk performance, blocking, deadlocks and indexes, and often it is more than one of these.
What happens to your query when the SQL server runs it?
The diagram below shows the basic flow: –
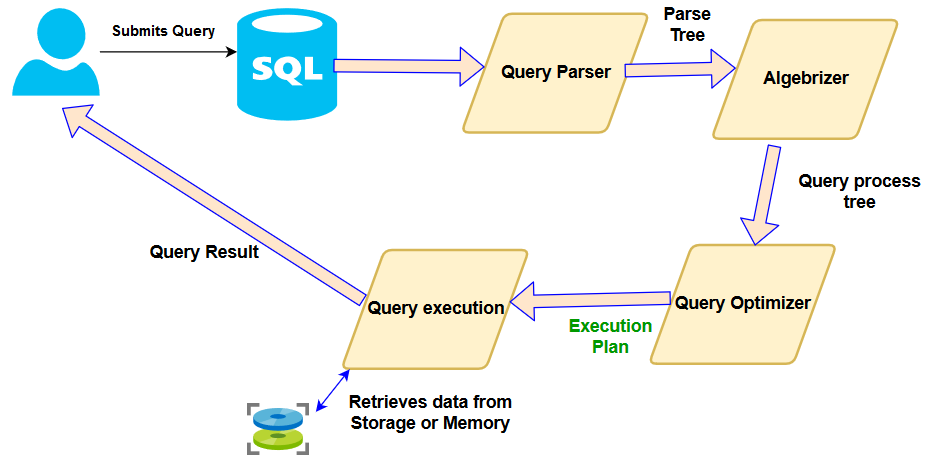
- The user or application authenticates with SQL Server and submits a query.
- SQL Server parses the query and checks for any syntax errors.
- The parse tree is processed further in Algebrizer, which resolves all objects, tables and columns in the query. It also performs a check on the column data types. If there are any issues, it returns an error. The Algebrizer generates a query process tree and a query hash. If the execution plan already exists, SQL Server uses that cached plan and executes the query.
- If a plan doesn’t exist or is obsolete, the Query Optimizer performs a full cost-based optimization with the help of statistics, query process tree and constraints. Based on those inputs, it prepares the cost-optimized SQL Server execution plan.
- Finally, the SQL Server query engine executes the query according to the execution plan and returns the results.
SQL Server provides estimated and actual execution plans, similar to what you experience when you need to repair your car. A mechanic inspects your car, and you receive an estimate of the work based on your requirements, the vehicle condition and the approximate time and materials the mechanic thinks the repair will take. Of course, the actual cost and time may differ. This is the same with estimated and actual SQL Server execution plans.
Why are there estimated and actual plans SQL?
You might be asking why there are estimated plans at all. In practice, most of the time, they are very similar or even identical. There can be a larger difference when there are stale statistics. Statics become stale when index rebuilds are not scheduled, or table data changes frequently. This is one of the reasons that databases need maintenance, like your car.
Another reason for differences between estimated and actual execution plans is where parallel execution comes into play. At compile time, the query optimizer builds an execution plan and produces a serial or parallel plan depending on query cost and the cost threshold of parallelism. While the execution plan may be the same for serial and parallel modes, SQL Server decides based on server resources and activity.
Where to find the execution plan
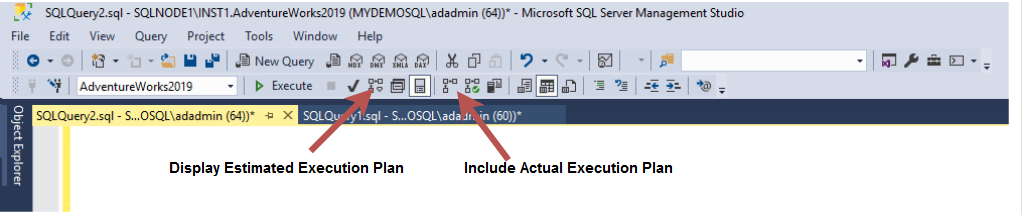
In SSMS, there are icons on the screen to show these plans, as seen in the screenshot above.
You can visualise the execution plans graphically, as XML, or as Text. Typically, I use the graphical display.
Clicking the estimated execution plan displays a screen like this: –
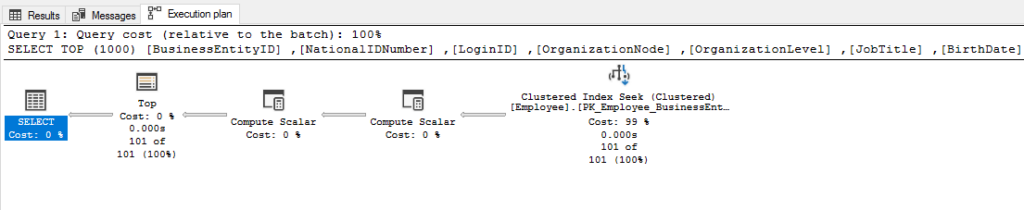
Operators
Operators are displayed as icons. Each operator is assigned to perform a specific task. For example, the query optimizer in SQL Server might perform a table scan, an index scan and a seek.
Percentage cost
The graphical plan shows a percentage cost associated with the operator. That cost is relative to the other operators used in executing the query. You can see an obvious item with a high percentage number in some queries; others show a relatively even spread of percentages across several operators.
Dataflow arrows
Arrows connect the operators, their width reflecting the number of rows of data moving from one operator to the next.
For instance, if your query generates a single output row but takes a long time to complete, moving the mouse to the data flow arrow in the execution plan, you find that the number of rows read is in the millions. That represents a huge imbalance in resource utilization and reveals an area needing optimization.
Summary
Execution plans are a great way to understand what SQL Server does with the queries we send to it. It is a valuable tool in your SQL debugging arsenal!


