
Introduction
One of Playwright’s most useful features is its Trace Viewer. This blog post explores what Playwright’s Trace Viewer is, how it can be used, and how it can help in web application testing.
If you need the latest version of Playwright, you can find it here.
Introduction to Playwright’s Trace Viewer
Playwright Trace Viewer is a powerful diagnostic tool that allows developers and testers to visually inspect what happened in a browser during a Playwright test run. This tool captures a wealth of information, including screenshots, network requests, API calls, and user interactions, providing an insightful look into the sequence of events that led to a particular state or issue.
Key Features
- Screenshots: Captures screenshots after each action, helping visualise the sequence of events.
- Network Activity: Logs all network requests and responses, making it easier to debug network-related issues.
- Console Logs: Records all browser console logs, errors, and warnings.
- User Interactions: Tracks user interactions like clicks, input events, and navigations.
- API Calls: Provides insights into the API calls made during the test.
Here are some screenshots from Playwrite: –
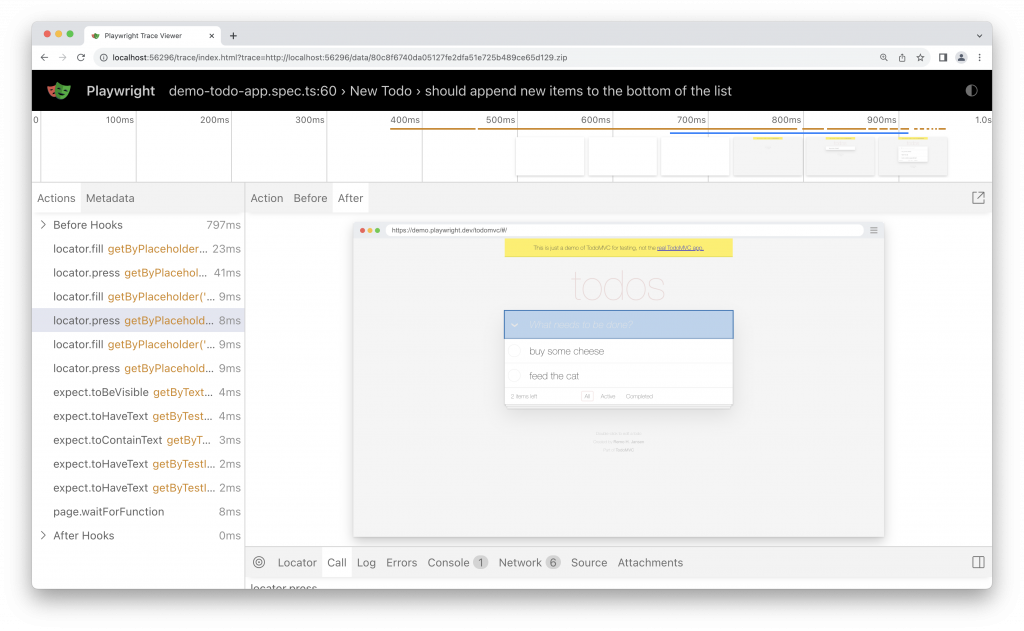
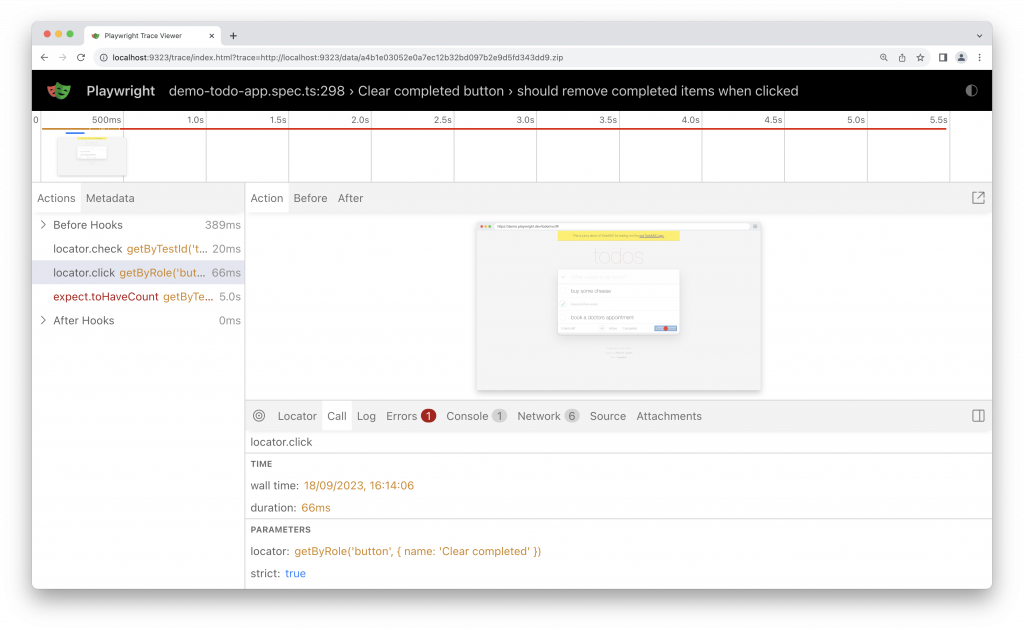
Here is what a snapshot looks like: –
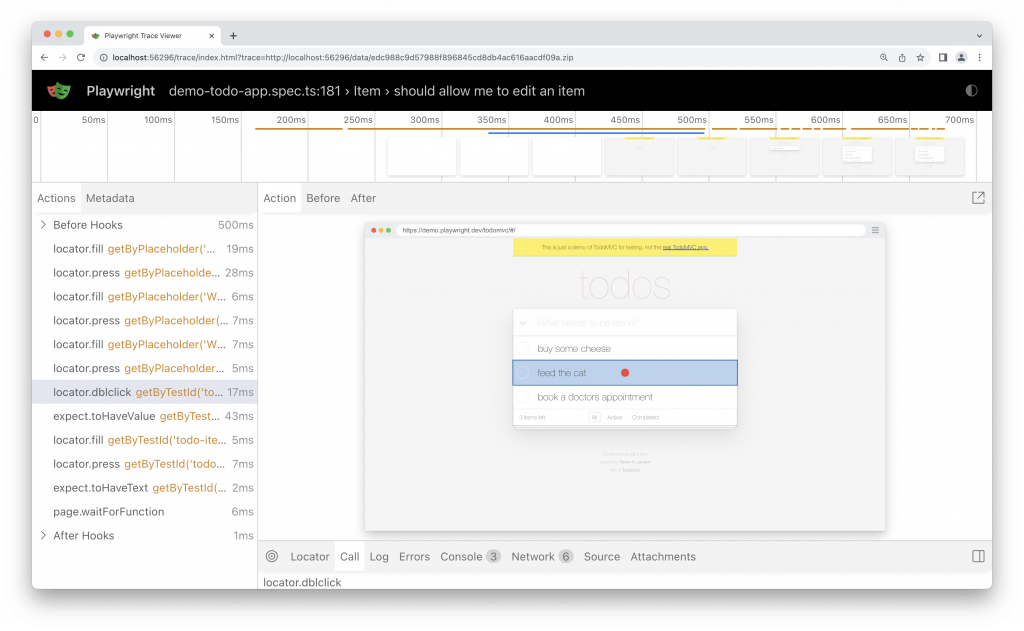
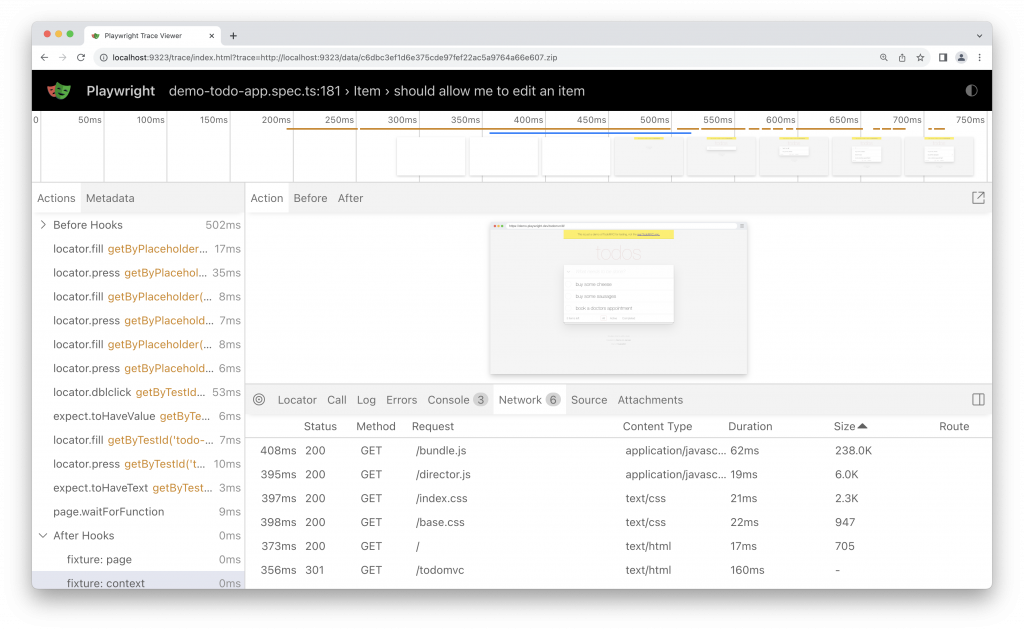
If you hover over the actions in the left of the screen, you can see the source code from the test that created them on the right:
If there was a call to an endpoint, you can see that too: –
This includes the time it took, what was sent to the endpoint and what came back.
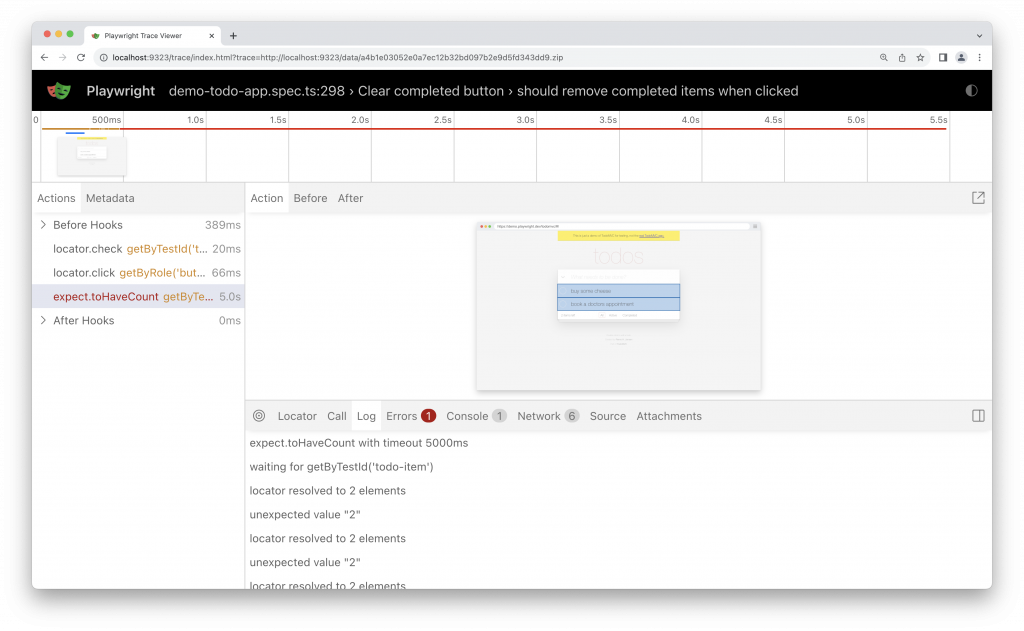
There is even a log of what Playwrite did: –
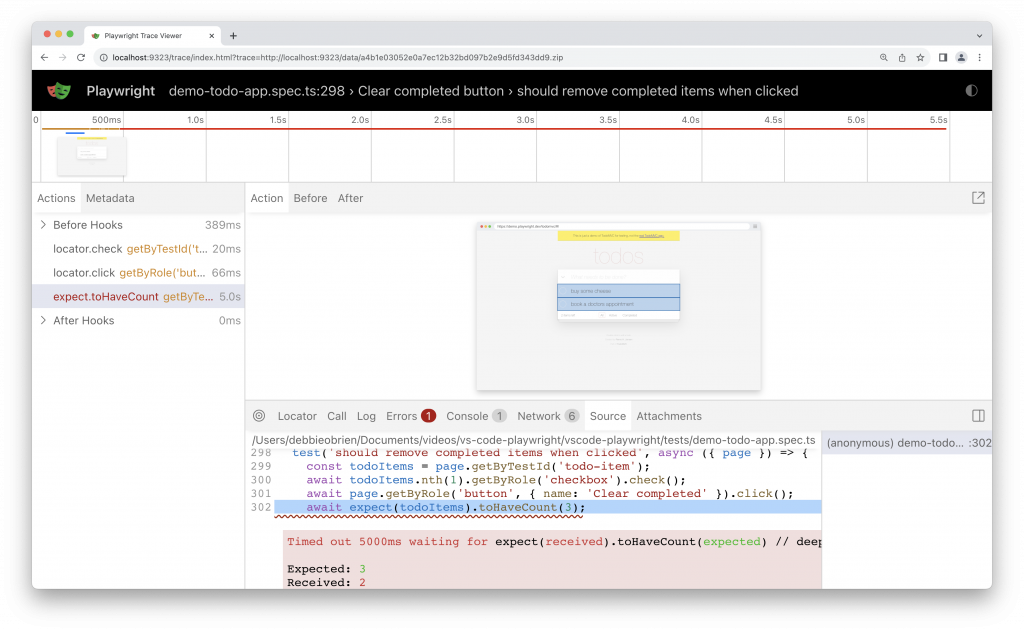
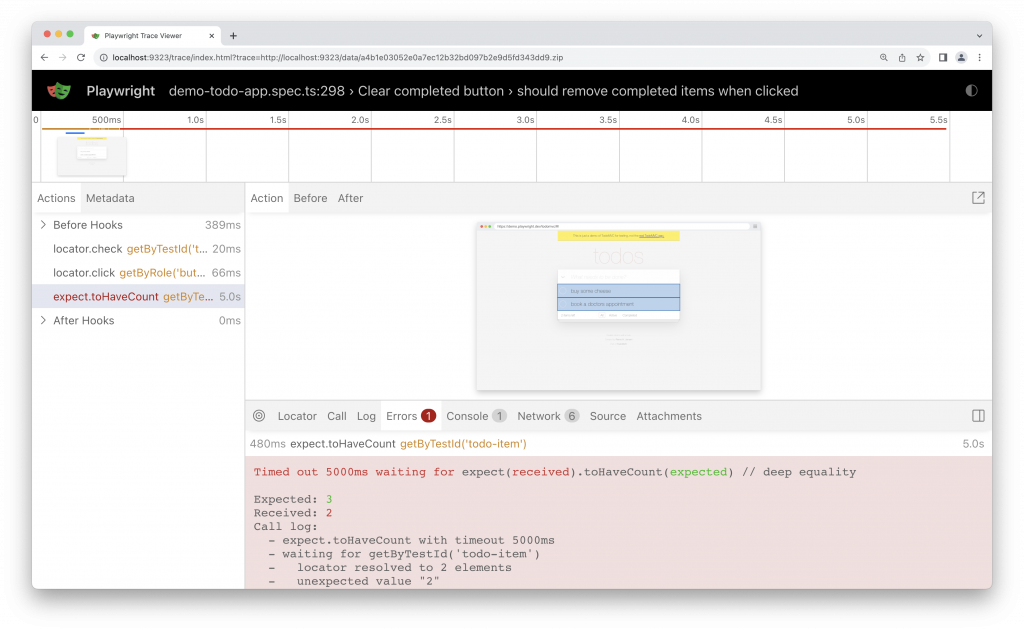
Errors can be viewed in detail: –
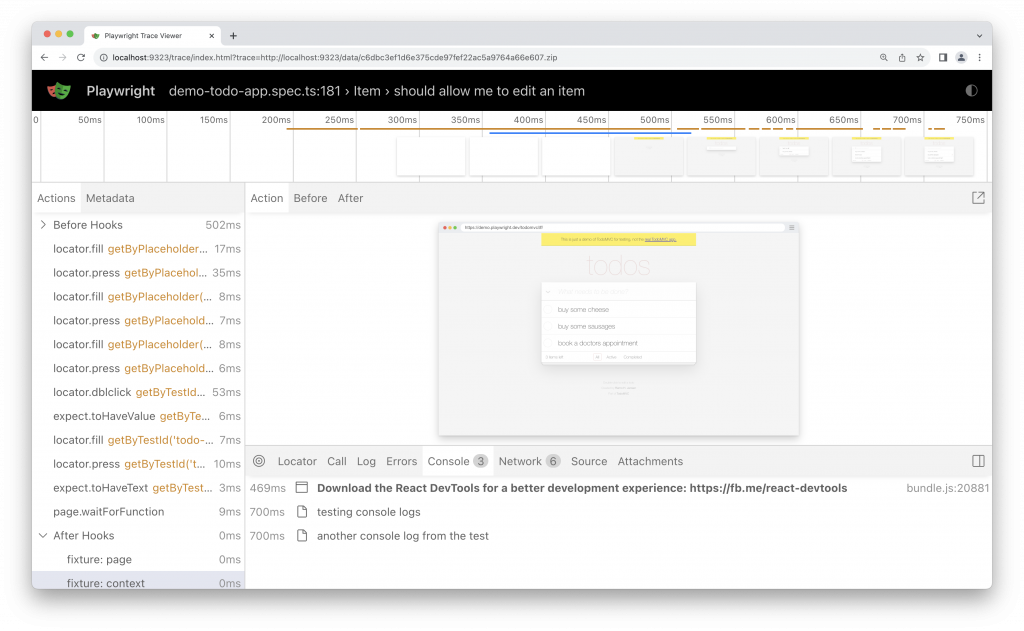
You can see the sites console messages: –
One of my favourite items is the network section. Here you can see what happened, where the site went to, how long the calls took, what was downloaded etc. :
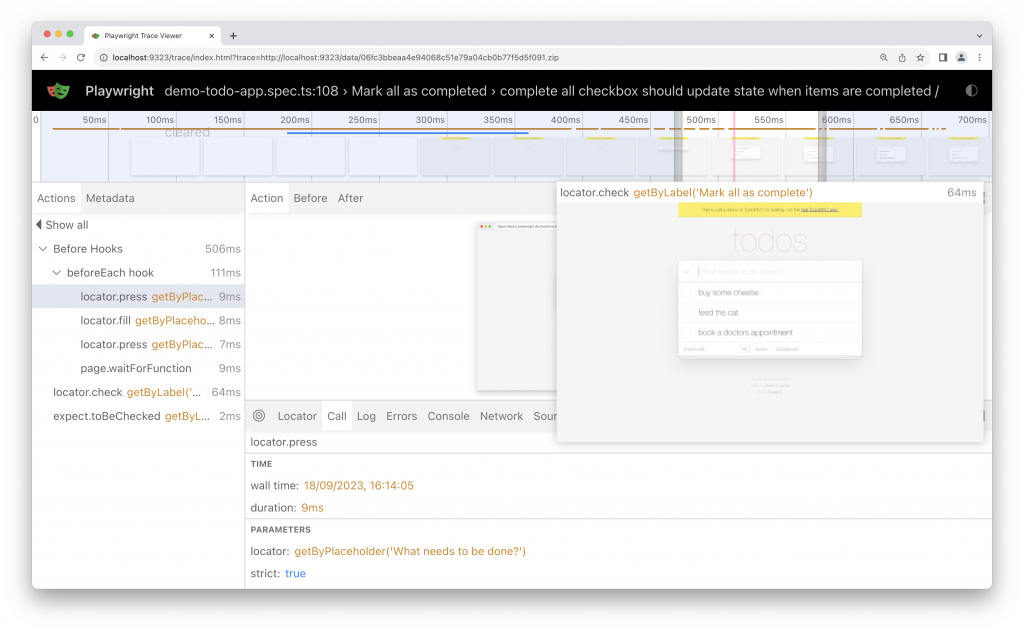
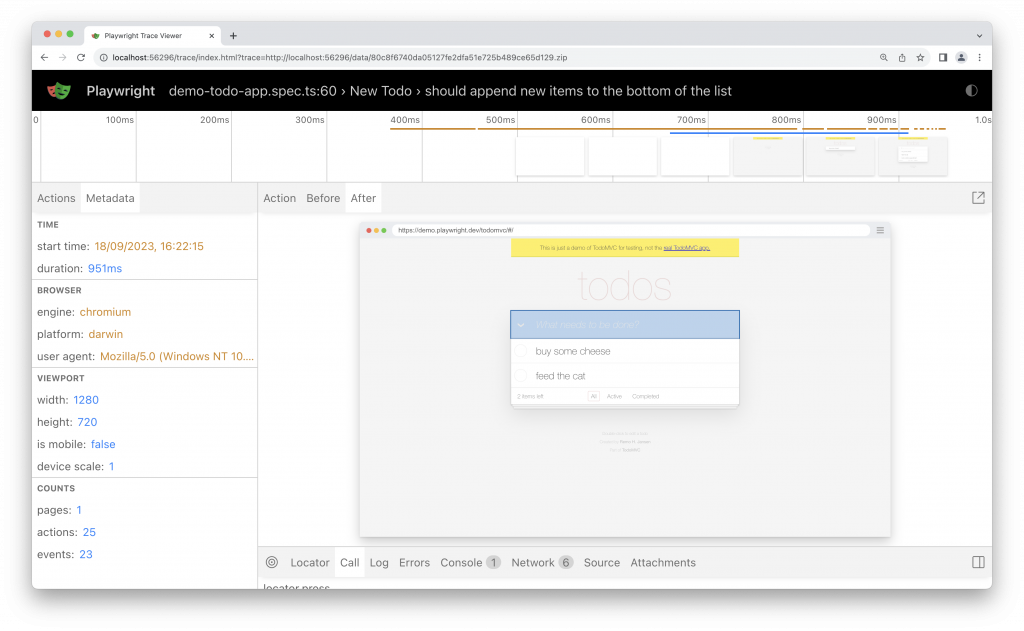
You can view the metadata here: –
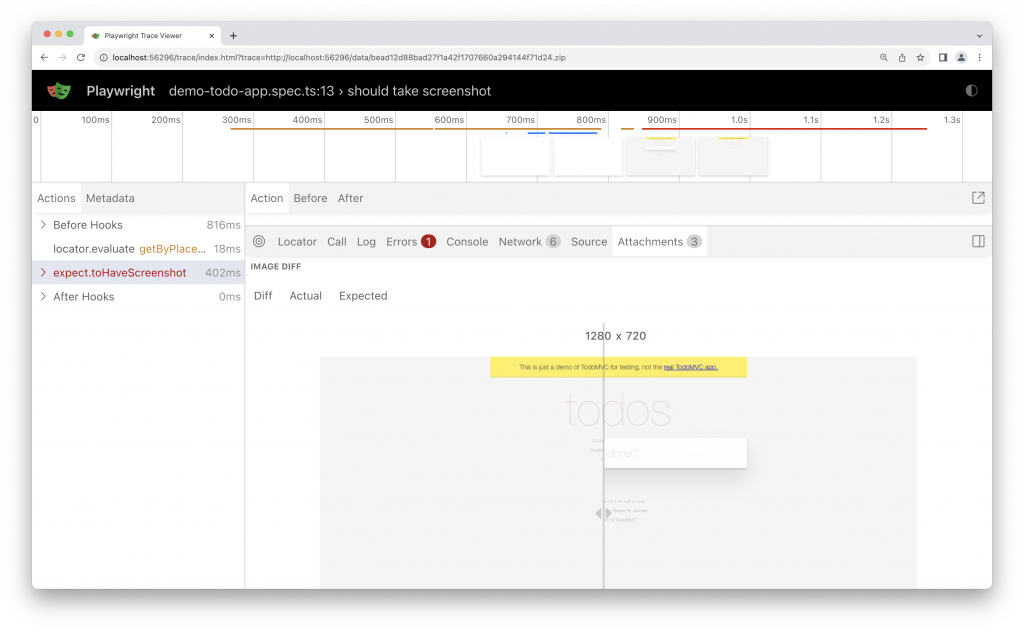
If you’re doing visual regression testing you can compare screenshots by examining the image diff, the actual image and the expected image. When you click on the expected image, you can use the slider to slide one image over the other so you can easily see the differences in your screenshots. This makes it much easier to see the differences instead of playing the game of ‘spot the difference’.
How to Use Playwright’s Trace Viewer
Setting Up Trace Collection
To use the Trace Viewer, you first need to enable trace collection in your Playwright tests. Here’s a basic setup:
// In your Playwright test script
const { chromium } = require('playwright');

(async () => {
  const browser = await chromium.launch();
  const context = await browser.newContext();

  // Start tracing before starting the scenario
  await context.tracing.start({ screenshots: true, snapshots: true });

  // ... your testing scenario ...

  // Stop tracing and export it into a zip archive
  await context.tracing.stop({ path: 'trace.zip' });
})();
This script will generate a trace file that can be opened with Playwright’s Trace Viewer.
Opening the Trace Viewer
To open the Trace Viewer, use the command line:
npx playwright show-trace trace.zipThis will launch the Trace Viewer interface with the trace you recorded.
Why Playwright’s Trace Viewer is so useful
Comprehensive Debugging
The Trace Viewer offers a multi-dimensional view of the test execution. It’s not just about what happened, but also about the context in which it happened. This holistic approach is crucial for debugging complex scenarios.
Time-Saving
Diagnosing issues in automated tests can be time-consuming. The Trace Viewer accelerates this process by providing a clear and interactive way to review test executions, reducing the time spent on identifying and fixing issues.
Collaboration Enhancement
With the ability to export and share traces, teams can collaborate more effectively. Rather than describing an issue, testers can provide a visual representation of the problem, making it easier for developers to understand and address it.
Easy Integration
Integrating Trace Viewer into existing Playwright tests is straightforward, as shown in the setup. This ease of integration means teams can start leveraging its benefits without a significant overhaul of their testing framework.
Conclusion
Playwright’s Trace Viewer is an indispensable tool for anyone involved in automated web testing. It simplifies the debugging process, saves time, enhances collaboration, and integrates seamlessly with your Playwright tests.
Whether you’re a developer trying to pinpoint a bug or a tester trying to understand the behaviour of a web application under test, the Trace Viewer provides the insights needed to make informed decisions and improve the quality of your web applications.
You can find some of my other Playwright posts here: –


